
Incident investigations usually begin with a triggered alert. One of the sensors deployed across your organization claims that suspicious activity has occurred on an endpoint, or was detected in its outbound network traffic.
There can be different triggers, and they might be accurate or not. In order to determine the actual cause, we have to investigate the originating machine.
The readily available data you receive comes from logs and alerts—which can give you a high-level indication of possible threats—but the ground truth will only be found through memory analysis. Memory analysis can reveal the code that was executed.
It’s for this reason we provide our Endpoint Analysis tool, which allows for a full memory scan and analysis of any live Windows machine. However, many of our customers who work in IR don’t always have access to live machines, and in many cases, only receive memory dump files from the suspected endpoints.
I want to demonstrate how you can accelerate the memory dump analysis process, using the Volatility memory forensics framework, along with the Intezer Analyze CLI. For this demonstration, I’m going to use one of the training memory dump samples provided by The Volatility Foundation.
The general purpose of this process is to gather the available executable modules from the dump file and then genetically analyze them in Intezer Analyze. The results will be the designation of each file or module as trusted or malicious.
First, we need to figure out the ‘profile’ of the memory dump. This is the operating system version of the machine which ran this code in the first place. If we don’t specify the profile, Volatility will need to guess it every time.

volatility -f [memory_dump_file] imageinfo
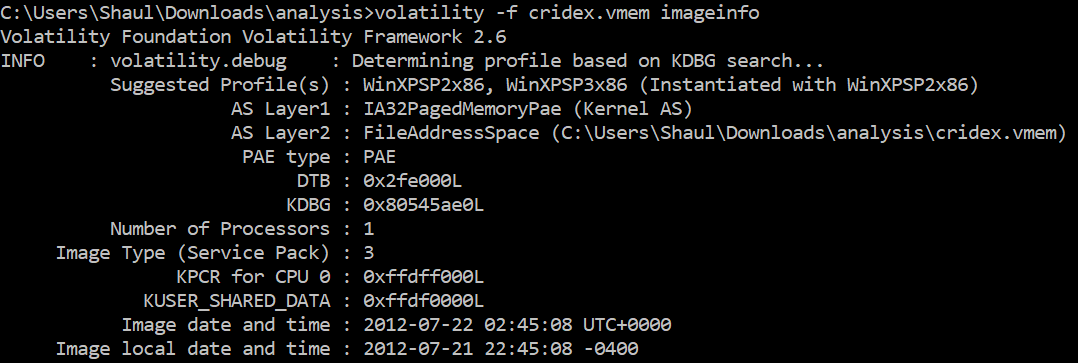
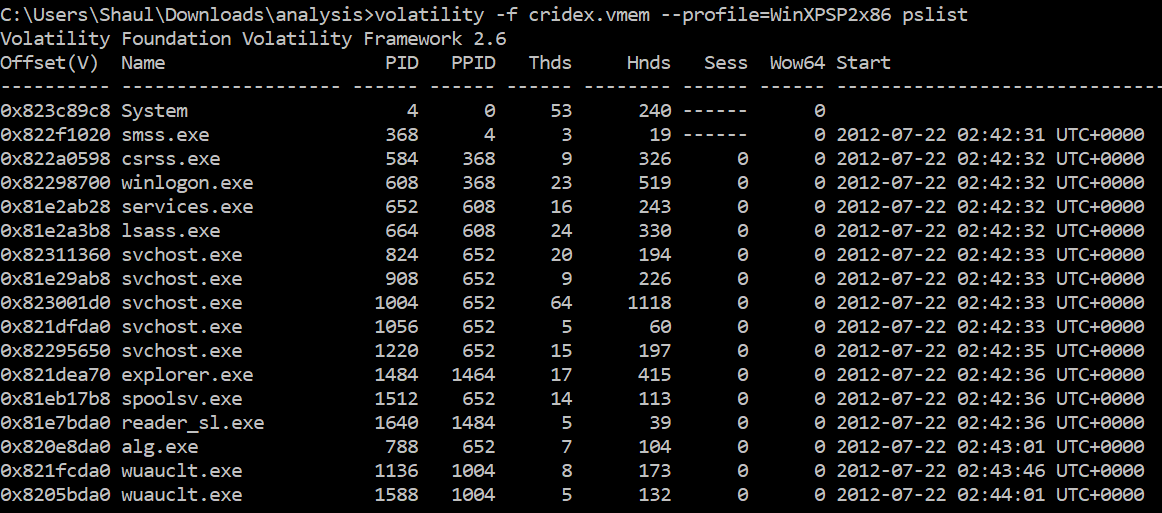
Now we know this is Windows XP with either SP1 or SP2. Let’s check what processes were running at the time this image was taken, using pslist.
volatility -f [memory_dump_file] --profile=WinXPSP2x86 pslist
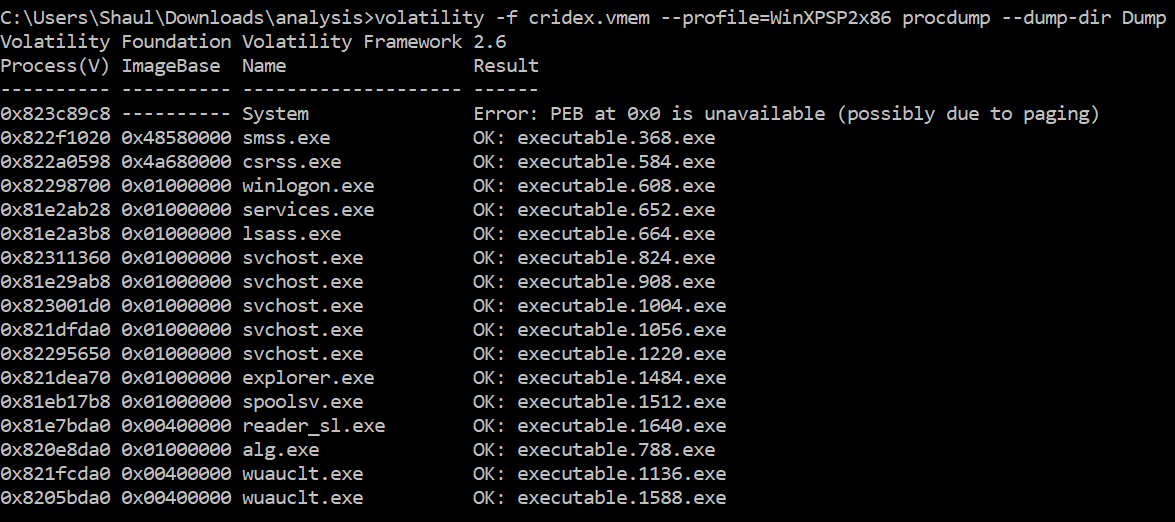
In order to retrieve the actual binaries and analyze them in Intezer Analyze, use the procdump module:
volatility -f [memory_dump_file] --profile=WinXPSP2x86 procdump --dump-dir [dir_path]
Now all you need to do is use the Analyze CLI to upload the contents of the Dump directory:
intezer-analyze analyze [dir_path]

We can review the results in the analysis history page:
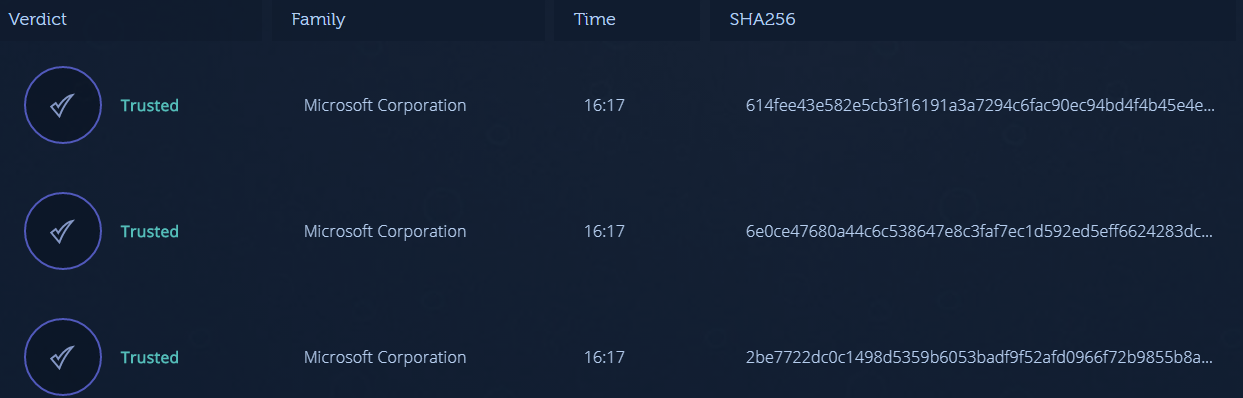
Up to this point, we see only trusted code.
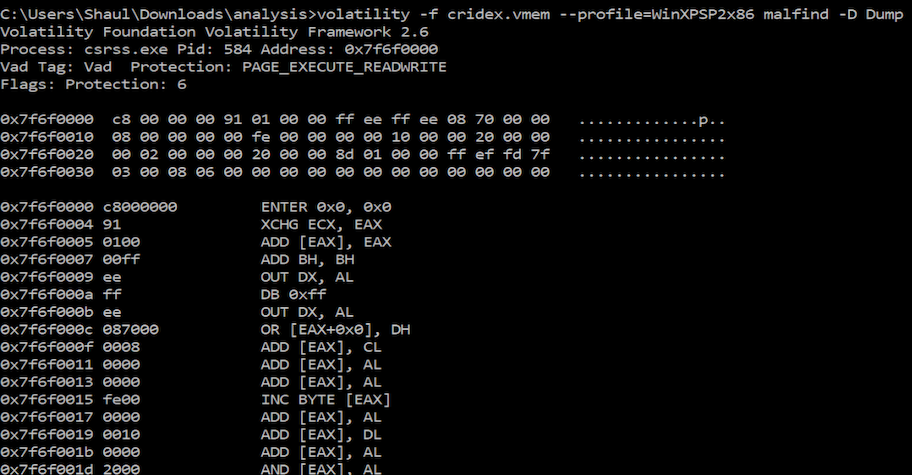
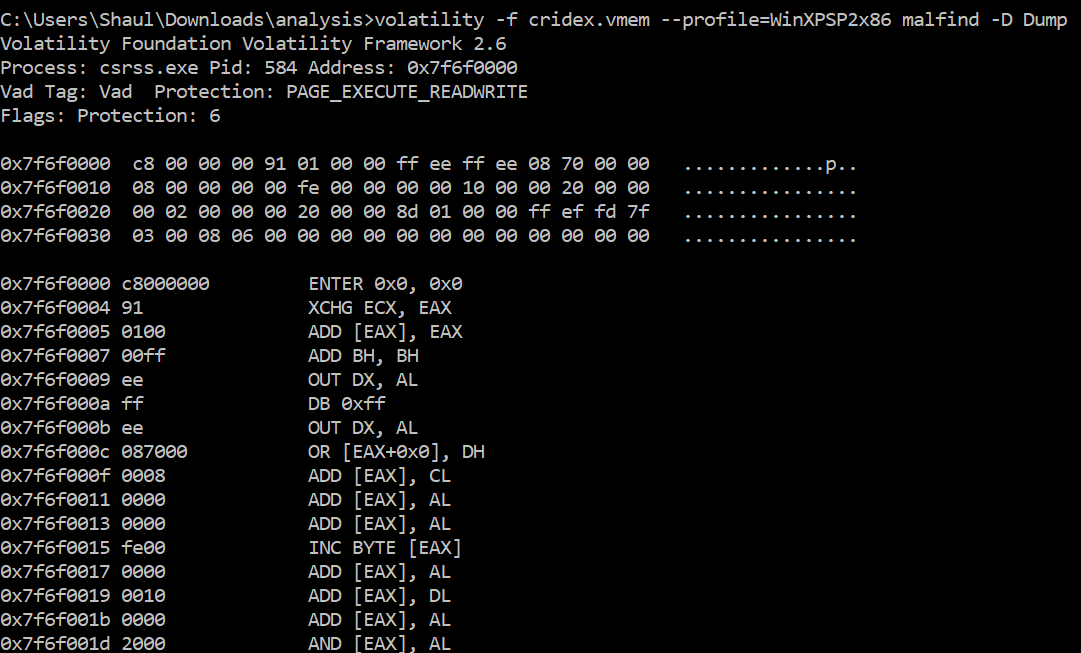
There could, however, be additional code artifacts hidden within the memory dump which aren’t as easily accessible. By using another Volatility module called malfind, we can look for potential memory injections and extract additional code items. The malfind module analyzes the code itself which was found in the memory dump. By looking for specific instructions, patterns, and attributes, it can locate suspicious memory regions which wouldn’t necessarily be detected otherwise.
volatility -f [memory_dump_file] --profile=WinXPSP2x86 malfind -D [dir_path]
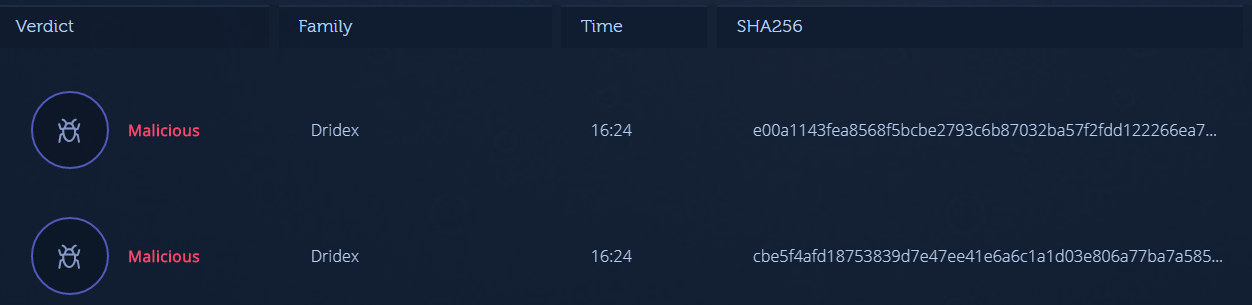
The malfind module extracts these memory sections and dumps them into the directory of my choice. When I upload these samples to Intezer Analyze, note that most of them aren’t supported. This is because they don’t all retain the format of a normal PE file, since they were carved out of memory. In most cases this can be mitigated by using tools like shellcode2exe, which compile these shellcode blobs into a PE structure.

Two of the samples are directly supported in this case:
The process demonstrated above is not unique to Intezer and can be utilized with other malware analysis solutions as well. There are several advantages to using Intezer Analyze though:
-
- Static analysis only: It takes only a few seconds to receive the verdict.
-
- Genetic analysis: Code reuse analysis detects new and previously unknown threats, regardless of behavior or signatures which can be altered after being extracted from a dump.
-
- Malware family classification
To summarize, we’ve seen how using Intezer Analyze can dramatically accelerate memory forensics, which second to reverse engineering, is considered one of the more time-consuming tasks for incident response teams. By classifying trusted and malicious code, it can be easier to find the necessary artifacts in memory and classify threats.
All the resources you need are listed below. To get started, make sure you have an Intezer Analyze community account and download the CLI. For those interested in more advanced capabilities and additional file uploads, upgrade to our enterprise edition.
Create an Intezer Analyze community account
Download the Endpoint Scanner
Get the Intezer Analyze CLI


Shaul Holtzman
Shaul is the Senior Director of Solutions Engineering at Intezer. He has over a decade of experience in cybersecurity technologies and methodologies, with background in malware analysis, forensics and incident response.
In this article
Share article
Accelerate Memory Forensics with Intezer Analyze
.png)
AI SOC
AI
Company News
5 minutes
Loop engineering comes to the SOC: Introducing the Intezer Org Brain
Organizational context in an AI SOC is table stakes. Org Brain is very different. It learns, it recalls, it fetches what it's missing, and it gets sharper with every alert it touches, all autonomously.

Detection Engineering
AI SOC
8 minutes
Detection engineering in the AI era
AI is lowering the barrier to sophisticated attacks. Explore why detection engineering matters and where most programs fall short.

AI SOC
CISO
Company News
Introducing Custom Agents: Automate your SOC, your way
Add your own agents and automations on top of the ones Intezer runs out of the box, take more of the manual work off your analysts, and tailor AI SOC to the way your team actually operates.